


At the Edge of Measurement
Earth observation is a translation problem: a rich physical world arrives as a small set of numbers, and most of what was there does not survive the trip.
This project looks at how we extract meaning from Earth system data when observations are incomplete, indirect, or noisy. It focuses on how insight emerges through interaction between physical measurements, human interpretation, and artificial intelligence, and how understanding shifts across scales, from a single sensor pixel to planetary-scale behavior. Rather than aiming for definitive answers, the work emphasizes exploration: holding uncertainty, testing assumptions, and observing what becomes visible when different ways of sensing are considered together.
The frontier of Earth and planetary science is not defined solely by what can be measured, but by how scientists learn to think at the edge of measurement itself.
Information Loss: When Many Truths Collapse to One Observation
Notebook: https://github.com/elenasavidge/b21-information-loss/blob/main/B21_information_loss.ipynb
A short interactive analysis (Appendix I) exploring how a blurry photograph and a satellite pixel share the same fundamental problem: many possible truths collapse to a single observation, and recovering what was there requires assumptions the observation itself does not provide.

A short visual essay about what it means for an observation to be a many-to-one map, and why the uncertainty in a measurement is really the *set of scenes consistent with what we see*, not a number.
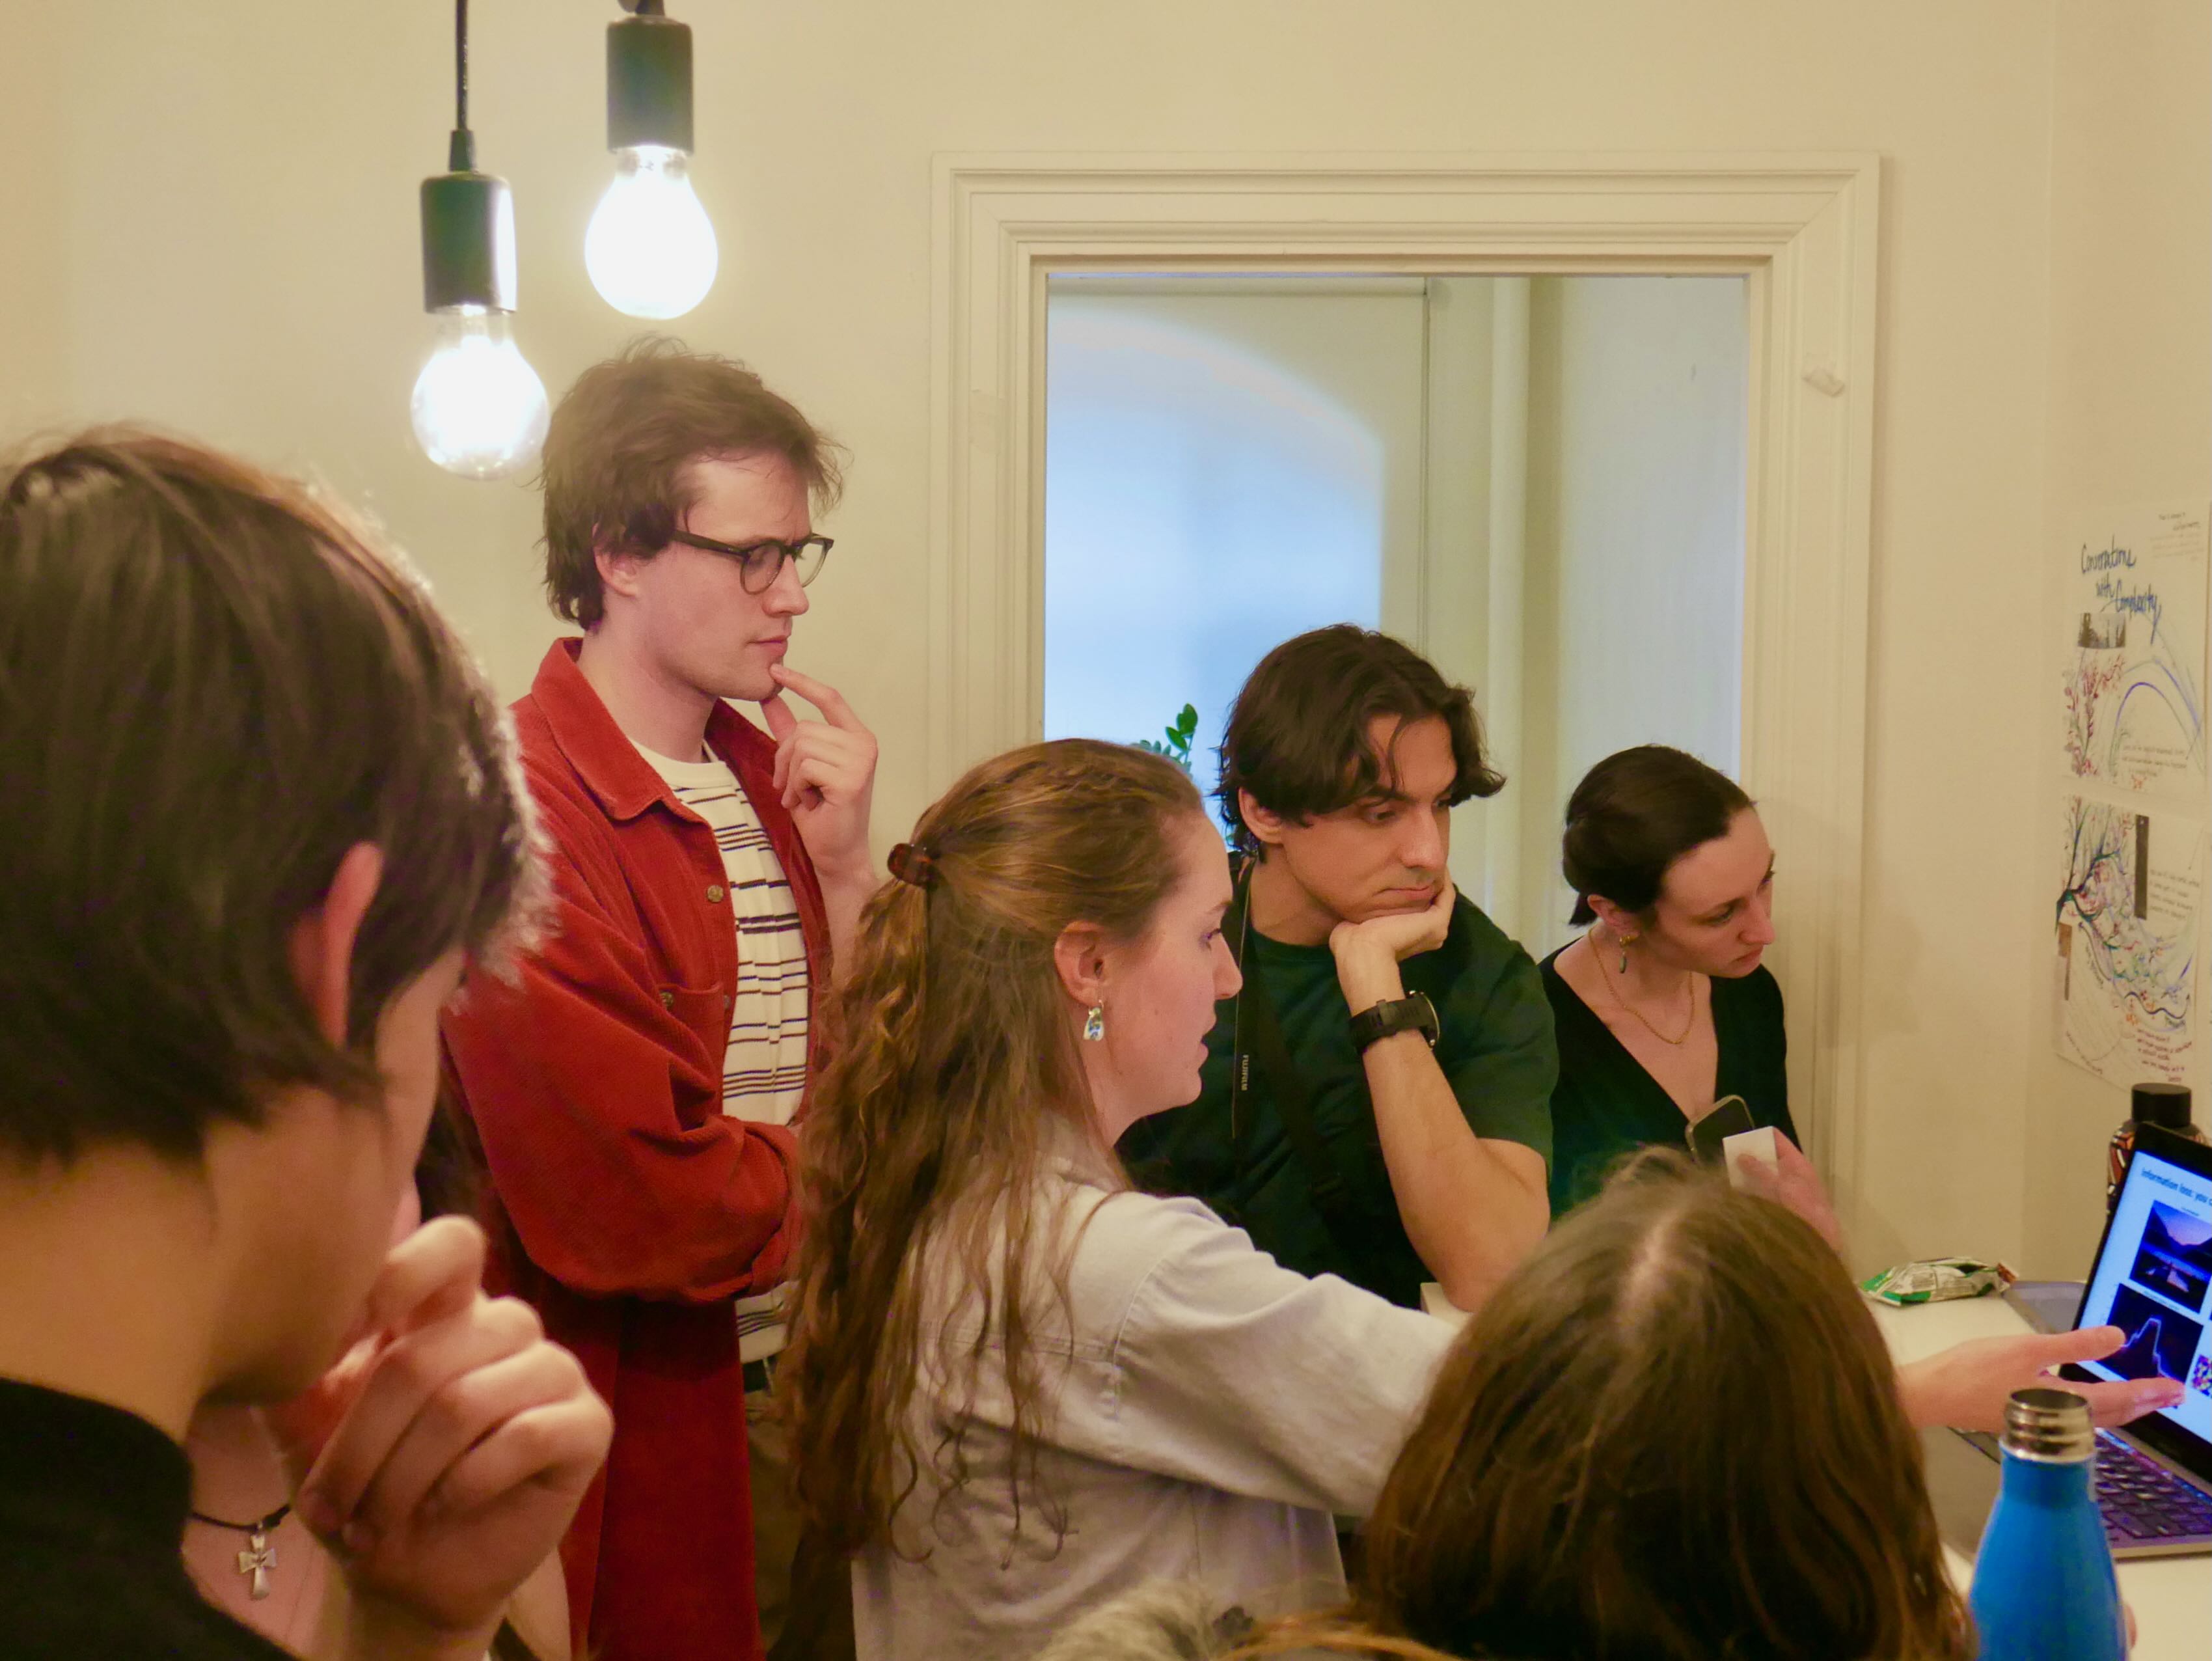
Built for the Building 21 Showcase at McGill University.
Two images carry the argument:
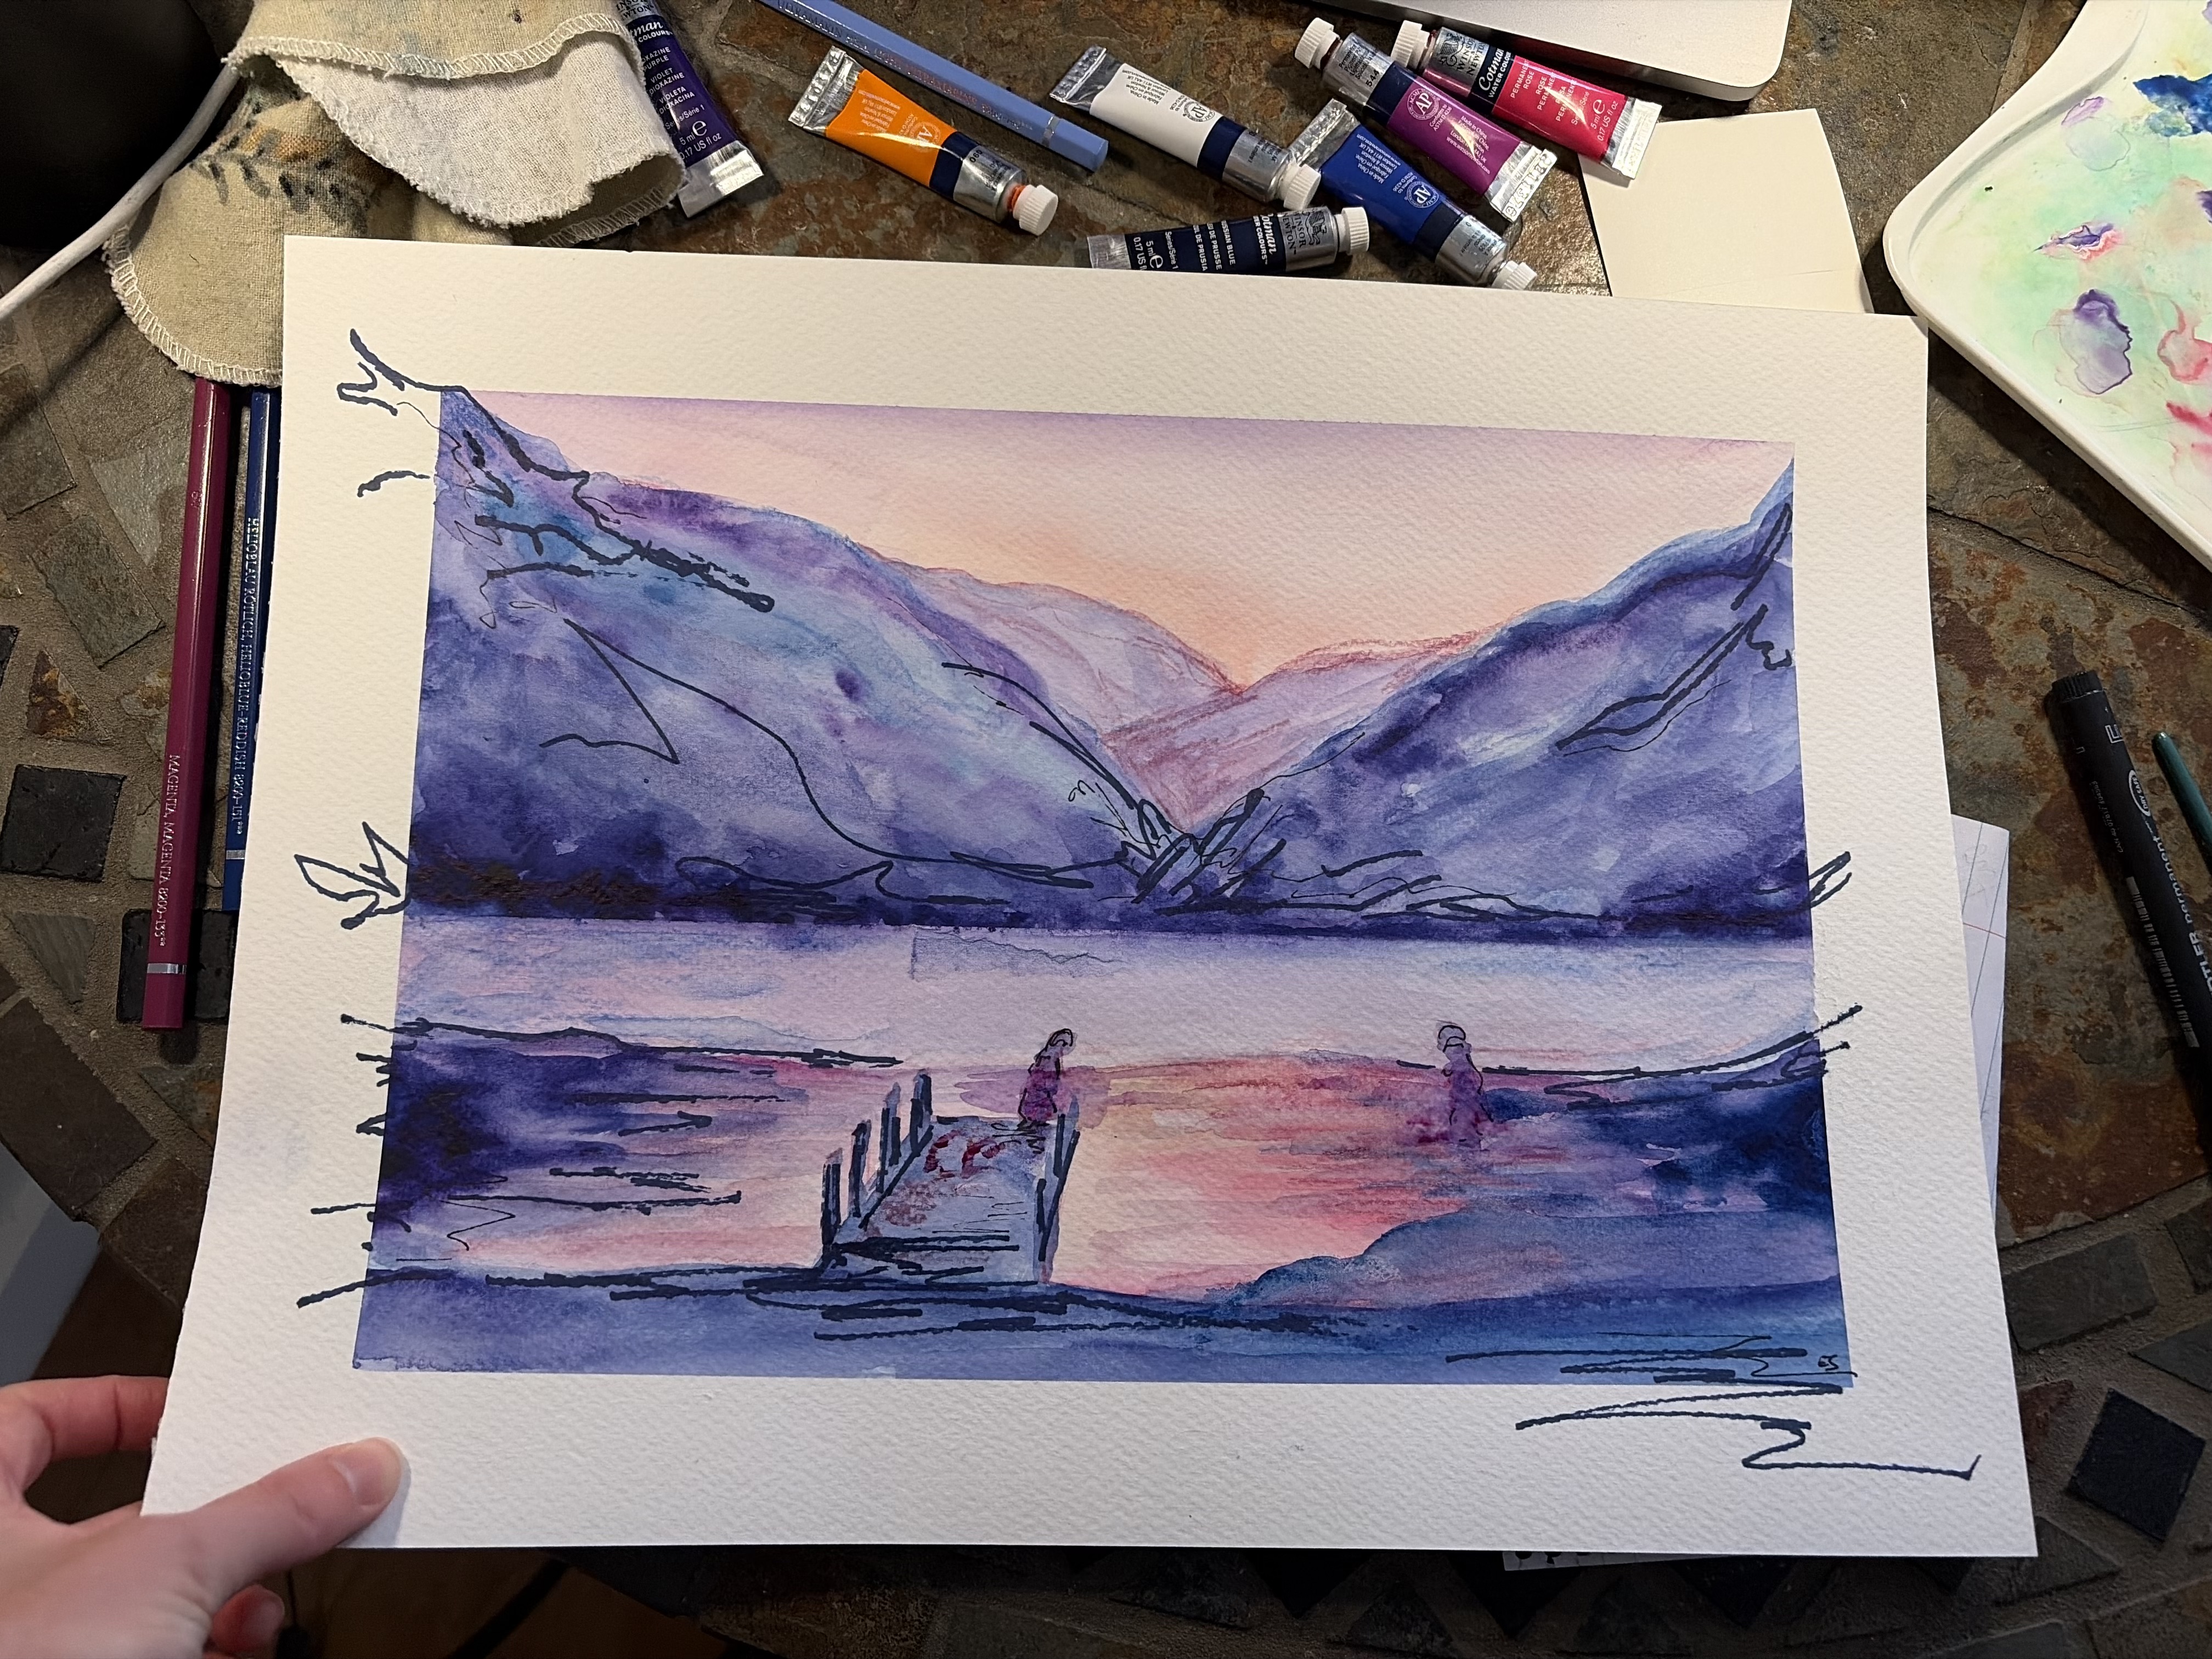
• a blurry dusk photograph of a lake, and
• a MODIS thermal satellite image of an Antarctic coastal polynya.
They look nothing alike at first. Different scenes, different sensors. But they share the same structure. The photograph averages light over time and space; the satellite pixel averages emission over ~1 km² of surface. In both cases, the *forward* process (blur, spatial averaging) is well-defined. The *inverse* is not: many different skylines produce the same blurry photograph, and many different sub-pixel mosaics of ice and open water produce the same pixel temperature. A reconstruction algorithm can still propose a plausible answer, but only by supplying information the observation itself doesn't carry: a prior, a model, another measurement. That ambiguity is the subject of the notebook.
What the notebook shows
1. The two observations, side by side.
2. A sharpness map of the photograph via local variance: where does detail survive, and where has blur erased it?
3. The satellite scene zoomed down to individual ~1 km² pixels, plus the visible-band view of the same region in summer, so you can see what's actually there.
4. Progressive pixelation of the photograph, watching the image *become* a satellite pixel.
5. Non-unique reconstruction of the skyline: many plausible sharp profiles that all blur to the same observed smooth curve.
6. Non-unique reconstruction of a sub-pixel: different 10×10 mosaics of open water, thin ice, and thick ice that all average to the same temperature.
7. A radially averaged Fourier power spectrum showing the high-frequency tail getting erased by increasing blur.
8. Shannon entropy of the photograph as a function of block-averaging: a number for how much information survives.
9. A final parallel figure tying the two observations together.
10. A watercolor painting of the scene: *one* reconstruction, drawn from the space of possible truths.
Running it
conda create -n infoloss python=3.11 numpy scipy matplotlib pillow cmocean jupyter -c conda-forge
conda activate infoloss
jupyter lab B21_information_loss.ipynb
Or via pip:
pip install -r requirements.txt
jupyter lab B21_information_loss.ipynb
The notebook ships with pre-executed outputs, so you can read it on GitHub without running anything.
Data
All the data needed to run the notebook is in this repo:
• photo.jpeg: the dusk photograph.
• painting.jpeg: a watercolor painted from the photograph.
• data/modis_thermal_B31.npz: MODIS Aqua Band 31 brightness temperature subset over an Antarctic polynya (2007/09/04). Preprocessed from granule `MYD09.A2007247.2205.006`, subset to ~75.3°S–74.55°S, 102.7°W–100°W.
• data/modis_visible_B1.npz: MODIS Terra 250 m surface reflectance Band 1 over the same region (2007/11/28). Preprocessed from granule `MOD09.A2007332.0705.061`.
The original MODIS HDF granules are hundreds of MB each and are not included here. The `.npz` files above contain only the small spatial subsets the notebook actually uses.
Author
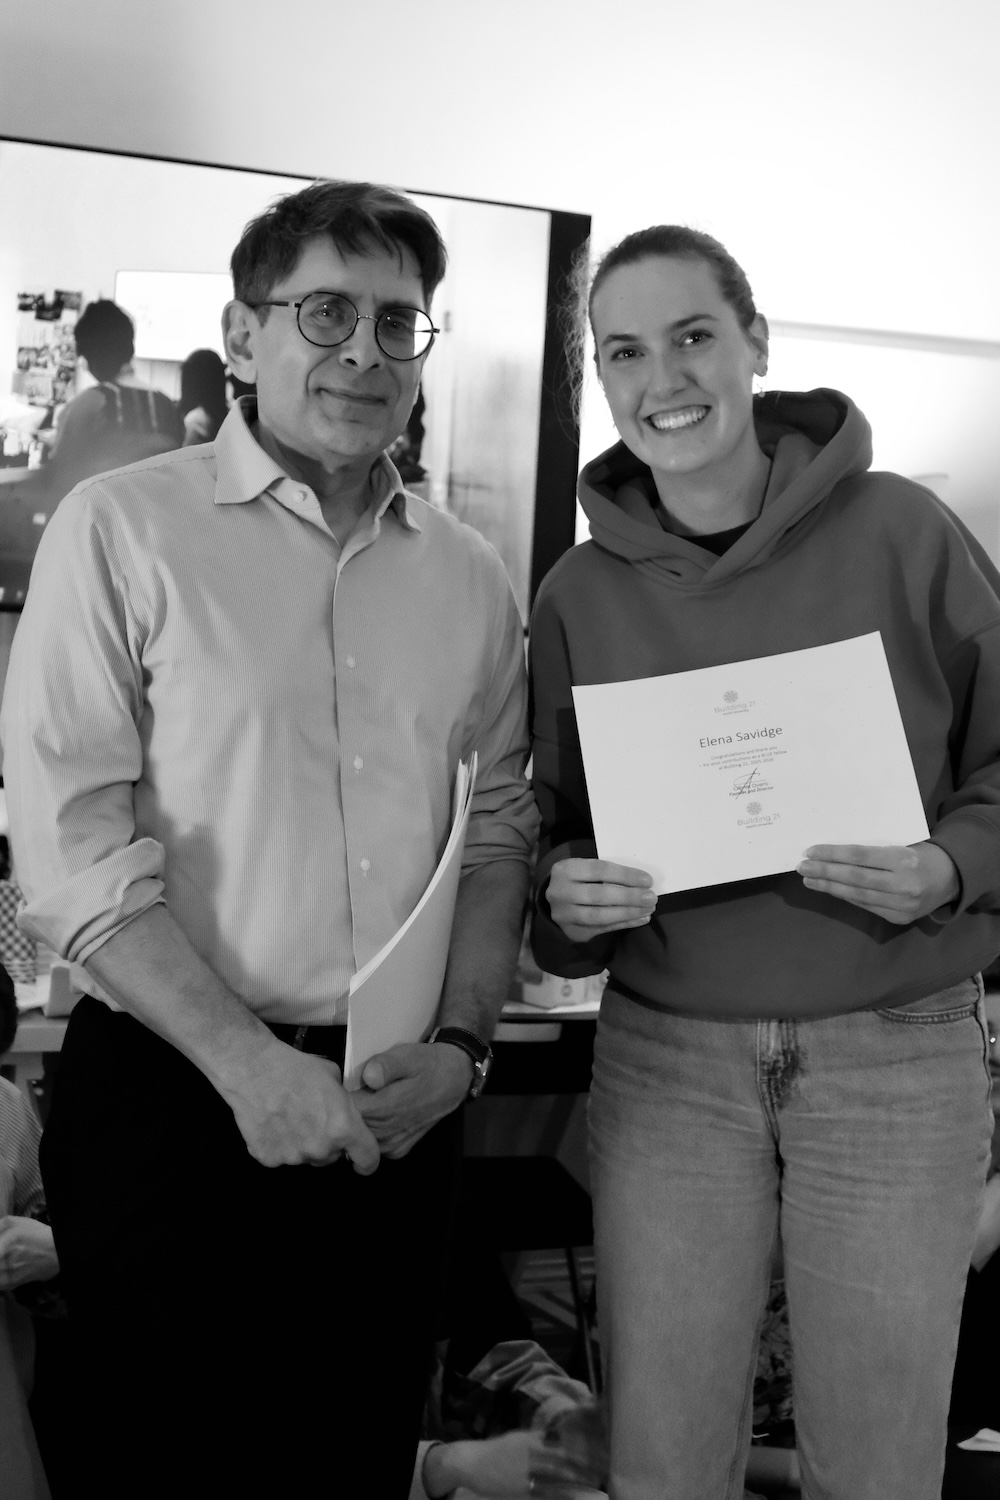
Elena Savidge
https://github.com/elenasavidge


Appendix I


Notebook: https://github.com/elenasavidge/b21-information-loss/blob/main/B21_information_loss.ipynb


.svg)